What actually breaks when a data pipeline hits a billion events
The failures that only appear at volume are structural, and almost none of them arrive as a crash. Eight of them, with the measured number that exposed each one.
Every event pipeline looks the same on a whiteboard. A client sends an event, something ingests it, something stores it, a query reads it back. That picture is as true at a million events a day as at a billion a month, which is most of why it is useless. The boxes barely change with scale. What changes is which box stops working without telling anyone.
This is a guide to those boxes. Every mechanism below is one we have traced through production systems operating at this volume, with the numbers from the incidents that produced them. The order is roughly the order in which a growing pipeline meets them.
How we traced these
Every failure below is traced to its mechanism: the code path that produced it, the setting that made it possible, and the measurement that exposed it. The numbers are the ones measured at the time each was found. Defaults are read at a fixed commit rather than taken from documentation, because what a system compiles is not always what its docs describe, and a guard that ships disabled is not a guard.
Where behaviour had to be observed rather than read, we reproduced it. The Kafka into ClickHouse hop runs on a bench with the same table shapes and settings, and the four failure behaviours in the last section are what it does when it is fed bad messages.
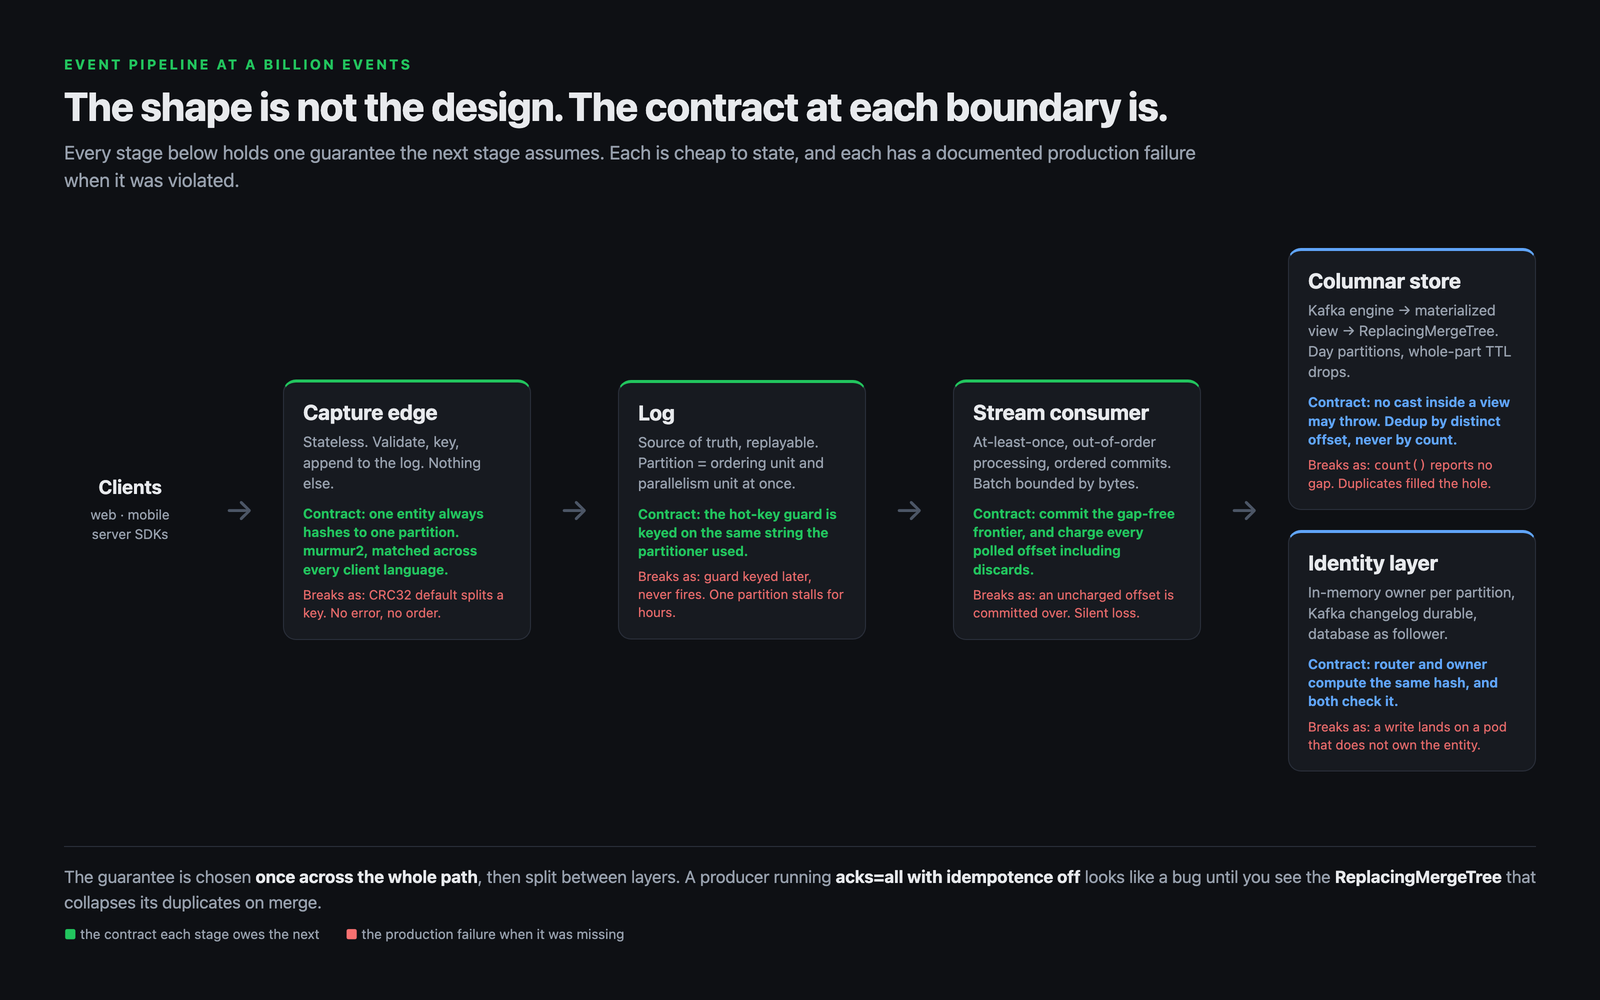
The partition key is the entire design
The key attached to a message decides two unrelated things at once, which is why it is so easy to get wrong. It decides ordering, because one key always lands on one partition. And it decides parallelism, because a partition is the unit of work. Pick a key that is too coarse and you have capped throughput at whatever one consumer can do, and nothing in the system will object.
In one production analytics pipeline a producer keyed its messages by tenant id alone, so every message from a single tenant hashed onto a single partition. At ten percent rollout the measurement was stark: partition 18 held 78% of the total output lag, 32 million messages out of 41 million, while 63 of the 64 partitions sat nearly idle. The ceiling was not where anyone would look for it. It was not the producer and it was not the broker. The columnar store's Kafka consumer assigns one thread per partition, so a high-volume tenant was being funnelled through exactly one thread at the far end of the pipeline. Widening the key from the tenant to the tenant plus a second field is a one line change that only makes sense if you know the whole path.
At the producer the same idea has a sharper edge. A good capture service builds its key as something like token:distinct_id, and it has to distinguish between sending no key and sending an empty one. No key makes the client round-robin across partitions. An empty string is a value, so murmur2 hashes it to one deterministic partition and every event in the system lands there. That is a one character difference between perfect spread and total collapse, and it deserves a comment next to the send.
There is a second way to split a key across partitions, and this one has no symptom at all until you go looking. Set the partitioner explicitly to murmur2_random if you are running librdkafka alongside Java, Python or Node producers on the same topic. librdkafka's default is CRC32-based; the JVM clients use murmur2. Leave the default in place and identical keys route to different partitions depending on which client produced them. Nothing errors. One user's events simply stop being ordered with respect to each other, and you find out weeks later from a number that does not reconcile.
The overflow policy is where the design stops being obvious. When a single user gets hot, the reflex is to spread their events across partitions. The correct answer is sometimes not to. If the consumer downstream updates a person or account row keyed on that same identifier, spreading one identity across partitions converts a hot Kafka partition into contended row updates in Postgres, which is worse. A pipeline that gets this right ties the two together explicitly: forced overflow, the operator-triggered kind, sends events keyless and switches off person processing for them, while a rate-limited burst keeps its key. Ordering is surrendered only where the stage that consumes it has also been switched off.
The detector itself is a keyed rate limiter, typically around 100 events per second with a burst of 1000, keyed on exactly the same string the partitioner uses. That last clause is not a detail; a section below is about what happens when it is violated. Two refinements earn their keep at scale. Match the forced-overflow list against both the full key and the bare token prefix, so one configuration entry can shed an entire abusive tenant without anyone enumerating its users first. And sweep the limiter's state on a randomized timer, 60 to 70 seconds rather than exactly 60, so a fleet of pods does not all take the same lock in the same second.
Committing is an accounting problem, and the accounting is where data goes missing
This is the part most teams underestimate. A Kafka consumer commits a single number per partition, meaning everything below this is done. If you process messages concurrently and out of order, that single number is a claim waiting to be false, because the moment you commit past a message that has not finished, a rebalance or a restart will skip it and nothing anywhere will record that it happened.
The structure that solves it properly is a per-partition offset ledger, and the shape is reusable. It is a dense sliding window over one contiguous offset range: a deque of slots, where the index of an offset is simply offset - base_offset. Charging appends at the back, completion indexes straight in and can arrive in any order, and a running count of the completed prefix is maintained on every completion. The consequence is that the frontier, meaning one past the highest gap-free completed offset, is available in constant time instead of a scan. Observing the frontier is non-mutating; taking it drains the completed prefix and resets the base. A hashmap of pending offsets does the same job and costs you a hash and an ordering comparison on the hottest path in the process.
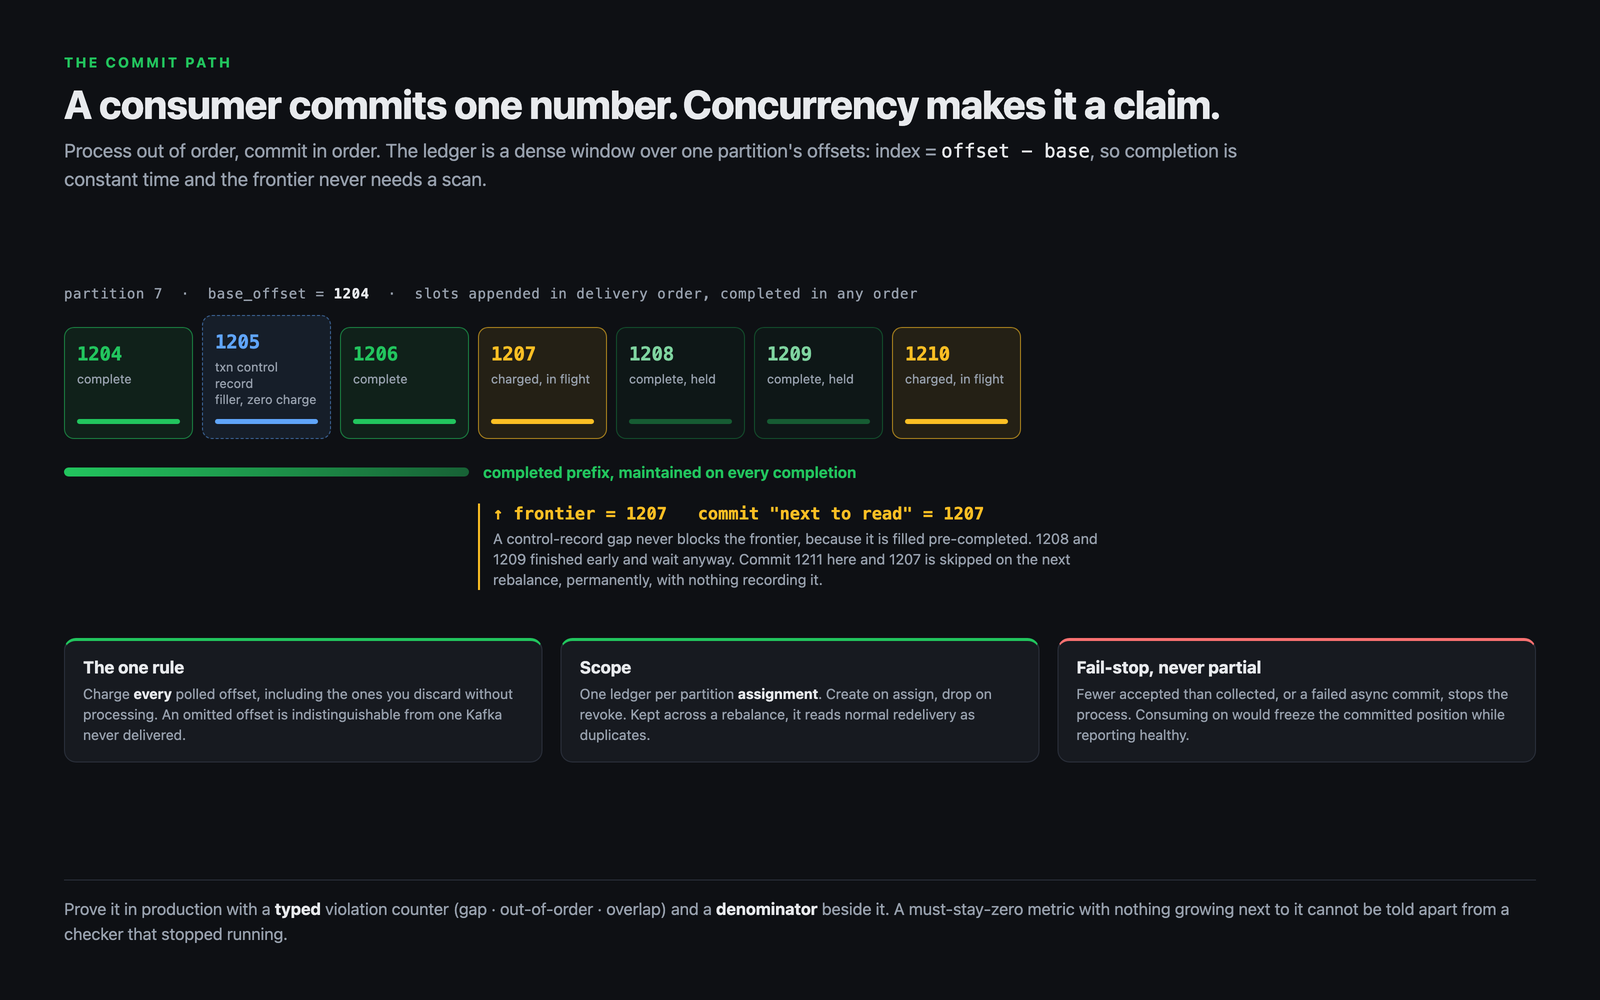
Three properties of that ledger are the ones that matter.
Every polled record must be charged, including ones you decide to throw away without processing. An omitted offset is indistinguishable from an offset Kafka never delivered, so the frontier commits past it as if it held no message. That is the entire data-loss surface of the design reduced to one rule, and it is the rule hand-rolled versions get wrong, because discarding a message you have judged to be garbage feels like the end of your responsibility for it. It is not. You still have to account for it.
Kafka's transaction control records leave real gaps in the offset sequence, and those gaps must become pre-completed zero-charge slots. Not because a control record needs tracking, but because dense index math has to stay aligned with actual offsets. Skip the filler and every subsequent completion targets the wrong slot, and the failure mode of that is committing offsets that were never finished.
A ledger belongs to exactly one partition assignment. Create it on assign, drop it on revoke. Keep one across a reassignment and it reads Kafka's entirely normal redelivery from the last committed offset as duplicate delivery, and starts rejecting work that is legitimately in flight.
Four choices sit around it, all pointing the same way. The plus-one that converts highest-done into next-to-read lives in exactly one place, so the commit path cannot double-apply it or forget it. Only the oldest in-flight poll is ever committed, so polls that finished early wait behind it rather than advancing the position over an older gap. If a poll ends with fewer messages accepted than it collected, the process fails rather than committing anything, because a partial commit cannot be honest. And a failed async commit stops the process on purpose, because consuming on would freeze the committed position while reporting healthy.
That last sentence is the thesis of this entire article, and it belongs in a comment in your own consumer.
A capacity knob has to count the thing that actually runs out
Every consumer has a batch size. The question that goes unasked is what unit it should be in.
Count it in messages and resident memory works out to background tasks times batch size times event size, doubled while a sub-batch is in flight. That bound holds only if event size is stable, and at volume it never is. Measured mean payloads across the lanes of one analytics pipeline ran from about 1KB to about 43KB, a 45x spread, so an identical batch-size setting bought 45 times the memory on one lane as on another. On the large-payload lane the count cap was physically unreachable: the prefetch queue is capped at 100MB, which holds roughly 2500 events at 43KB, so a 5000-message cap can never be filled. The batch utilization metric therefore read about 34% at full saturation.
Sit with that number, because it is the trap. A utilization metric reading 34% looks exactly like spare headroom, and the obvious response is to raise the cap. Raising it buys more memory and zero throughput.
The fix is a byte bound alongside the message and time bounds, and two things about how you ship it matter as much as the bound itself. Evaluate the check against bytes already appended rather than bytes about to be appended, so a batch always carries at least one message and the overshoot is exactly one message. That way a single payload larger than the entire bound moves through instead of wedging its partition indefinitely. And ship the new bound disabled by default, so rolling the image out changes no lane's batch composition and the byte limit becomes a per-lane decision made later with the metric in hand. That is what a capacity change to a live pipeline looks like when you cannot afford to be wrong twice.
Scaling out can amplify the load you scaled out for
The instinct when a stage falls behind is to add pods. At volume that sometimes makes the problem worse in a way the dashboard will not show.
Consider a stage that aggregates low-cardinality tuples in memory and flushes them periodically. With N pods, the same tuple exists in N separate hashmaps, and each pod flushes its own copy, so the store downstream receives N records for what is logically one update. One team measured it directly by collapsing the deployment from 12 pods to 1 and watching the records-per-event ratio fall from 0.17 to 0.092. Roughly 46% of that stage's output was cross-pod duplication rather than information.
The instructive part is the two fixes that were rejected. Re-partitioning the input topic by tenant alone would have recreated the hot partition from the first section. Routing in-process with consistent hashing over gRPC would have been faster, and it was rejected in writing because it rebuilds Kafka's partition assignment, rebalance and durability machinery inside application code. What shipped was a second aggregation pass over a new Kafka topic, on the grounds that Kafka topics are cheap and that machinery already exists and is debugged. At this scale the reason to prefer the boring answer is not taste. It is that the interesting answer has failure modes you would then own forever.
Liveness is not progress
This is the most expensive misunderstanding in the field, and it has two distinct shapes.
The first is a health check that measures the wrong span. One service was restarting in production 140 to 200 times a day because its liveness heartbeat fired only while the consumer was acquiring a batch, and never during the group resolution and database writes that followed. Any batch cycle longer than the deadline restarted the pod, while the pod was working the entire time. Then the loop closes on itself: every restart cold-starts the deduplication caches, which increases write load, which makes batches slower, which trips the deadline again. The health check was feeding the condition it existed to catch. The defensive version of the same insight shows up elsewhere as a consumer clamping its poll wait to 10 seconds even when the remaining batch deadline is longer, purely so the heartbeat keeps firing through a long collection window.
The second shape is worse, because the check is working correctly and still sees nothing. After a database failover, a connection pool poisoned only partially. One pod kept roughly a third of its writes succeeding, which was enough to heartbeat normally and to satisfy the stall detector, while it dropped around 60% of its writes for twenty minutes. Nothing alerted, because from the outside it was alive and from the inside it was two thirds broken.
The response to that one is the part worth studying. Failing liveness on partial pool failure is the obvious move and the wrong one, because a failover-triggered fleet restart aims a cache-cold write storm at the database that has just failed over. The measured number during the incident was a write rate going from about 7 per second to about 50 per second while caches refilled. The correct answer to a health check that cannot see a partial failure is a different signal, not a more aggressive reaction on the signal you have.
The general rule falls out of both: measure whether work is completing, not whether a process is running. Progress is committed offsets moving. Freshness is the newest readable record getting newer. Liveness is neither, and at low volume it stands in for both well enough that nobody notices the substitution until the day it fails.
A guard keyed differently from the partitioner cannot fire
Overflow protection can exist, be enabled, and be structurally incapable of working. The mechanism is worth understanding because the bug is invisible in each half separately.
Cookieless events are routed by something like token:client_ip, so all of one source's traffic lands on one partition. The rate limiter meant to divert hot traffic to an overflow topic runs later, inside the pipeline, keyed on a hashed identifier assigned at that point. For that class of traffic the hash is fresh for every event, so no per-key counter ever accumulates and no limit is ever exceeded. Read either half alone and it is correct. Run them together and the protection is blind, and a busy cookieless source stalls one ingestion partition for hours, delaying events for every other tenant routed there.
Key the limiter on the Kafka message key itself, the same value the partitioner used. A protection keyed on anything other than the thing it is protecting is decoration.
Permanent failures dressed as retriable ones
A consumer sends sub-batches to workers over HTTP, and the worker enforces a 20MB body limit, checked per chunk while the body drains rather than from a header, so it aborts mid-stream. In one case the web framework rejected the oversized body with a bare error carrying no status code, which the default handler rendered as a 500. The transport, reasonably, treats 500 as retriable.
Every worker enforces the same limit, so that sub-batch could never succeed anywhere. It retried, exhausted, re-stashed as deferred work, re-routed, and failed again, and the offsets behind it never committed. In the sampled window 81% of failures were this single loop. The correct status is 413, which means do not send this again, and the correct handling both recognises it and halves the batch on the way. Any permanent error misclassified as transient becomes an infinite loop that blocks progress behind it, and the misclassification frequently lives in a dependency you did not write.
The related problem is an error that genuinely is retriable but not yet. Kafka has no delayed delivery, so a backoff has to wait somewhere, and waiting in place blocks everything behind it. The cleanest answer we have seen is one topic per retry period: a one minute topic, a ten minute topic, an hour topic. The period belongs to the topic rather than to the record, so records leave in the order they become ready and an hour-long wait never sits in front of a one minute wait. It is a queue-shaped answer to a queue-shaped problem and it costs three topics.
The recovery mechanism can be what sustains the outage
The most interesting class of outage is the one where nothing is broken while it is happening.
A five minute worker scale-up produced roughly twenty-five minutes of sustained backlog churn, with no draining workers and no send failures at all through the long tail. The cause was queue discipline rather than any fault. While a routing key has deferred work, every later batch containing that key must also defer, to preserve order. A hot key appears in essentially every batch, so it refilled the queue as fast as completion-paced flushes drained it. The deferring state sustained itself and would not end until traffic stopped.
Then two safety mechanisms extended it. Deferred flushes preferred the key's pinned worker for cache locality, but a worker at its concurrency cap is still healthy, so flushes bounced off it until the flush timeout failed the process. And the flush timeout bounded the whole backlog rather than progress, so a slow but genuinely progressing drain still failed and restarted the process, which replayed its partitions into a pool that was already saturated. Around twenty consumer pods were cycling this way under sustained load.
The repair is small and the principle is large: make the timeout a no-progress timeout rather than a wall-clock one. Sixty seconds with nothing landing at all fails the batch. Sixty seconds of slow progress does not, because the deadline resets whenever anything lands. That is the same distinction as the liveness section, applied to a timeout instead of a probe, and it decides whether your recovery path helps or extends the incident.
A system composed entirely of correct, well-intentioned components can still hold a stable failure state it cannot leave on its own. Every mechanism in that outage was doing what it was written to do.
The identity layer, or how to stop coordinating through a database
The hardest part of an event pipeline is rarely the events. It is the mutable state hanging off them, because that is the one place concurrent writers meet. Person and account records are the usual example, and the shape that survives a billion events is an in-memory owner per partition, a Kafka changelog as the durable record, and the relational database demoted from arbiter to follower.
Three mechanisms make that safe, and each has a detail that only appears at scale.
Routing uses two different hashes, deliberately. A person maps to a partition by murmur2 over a string like team_id:person_id, reimplemented to match Kafka's own partitioner byte for byte and pinned by golden test values. A partition then maps to a pod by jump consistent hash over the partition number, which has the property that going from N to N+1 pods moves only about 1/(N+1) of partitions. The router computes the partition and the owner independently recomputes it, rejecting any request whose header disagrees. Two implementations of one hash that must agree exactly is normally a smell, and here it is the point: a write landing on a pod that does not own the person is the exact failure being prevented, so it is checked at both ends.
The changelog is produced to an explicit partition number rather than by handing the producer a key. Cache warming rebuilds one routing partition by consuming the same-numbered Kafka partition, so the two numbering schemes have to agree. Producing explicitly makes that alignment a property of the code instead of a property of the producer config happening to match the router's hash, which is the CRC32 versus murmur2 trap from the first section in a place where it would cost you correctness rather than ordering. A partition-count mismatch then fails loudly at produce time rather than mis-sharding in silence.
Concurrent updates to one entity serialize on a per-entity mutex, and the lock wait needs its own histogram. This is the detail we would steal outright. Every acked write holds the lock through an acks=all produce, so per-person throughput is capped near one over the produce latency, and contending updates spend their time waiting rather than producing. That queueing is invisible in the produce histogram. Produce latency can look perfect while the actual per-entity write path is saturated, and only a metric pointed at the waiting will show it. Sweep the lock map by reference count rather than removing entries on release, which sidesteps the race where one request removes an entry another is acquiring.
Three more decisions in that layer are the kind that get skipped and should not be.
Handoff between owners is a three-acknowledgement protocol, not a timeout. Every router acknowledges that it has stopped sending and started stashing, then the old owner acknowledges that its in-flight work has drained, then the new owner acknowledges that it has replayed the changelog up to the stable high water mark. Only then does the partition change hands. The replay rewinds a fixed margin past the writer's committed position as pure safety, on the reasoning that any value is correct and a larger one is more forgiving of a race between the writer committing and the new owner observing it.
Sizing is measured, not chosen. One recovery pool is set to 16 because a benchmarked writer outage showed a pool of 4 queueing for about 10ms on average and tripling write p99, while 16 removed the queueing entirely. Two numbers and a sentence do more for the next engineer than the constant ever could.
And when the structure tracking unflushed writes is full, new writes are shed with a resource-exhausted error rather than accepted, because acking a write that is durable but untracked reopens a hole where a stale value gets read back later. Refusing work is the honest failure. Accepting it and losing track of it is the silent one.
One caveat, because it is the kind of thing that separates reading code from reading systems. In the implementation we traced, the broker-level epoch fencing that stops a zombie owner from writing is behind a flag that defaults to off, with a note that the latency cost is still being measured. Reading defaults rather than just code is how you find out which of the mechanisms you just admired is actually running.
Your instruments lie, and sometimes the library does
If every failure above is silent, measurement is the only defence, so it is worth knowing how measurement itself fails.
Take two invariants worth proving: that every routing key is processed in offset order, and that offsets commit contiguously and monotonically. The obvious mechanism for the second is the Kafka client's commit callback, and for manual async commits it can be unreachable. One team proved that empirically rather than by reading documentation, with a probe in the callback that fired zero times across 123 commits that had demonstrably landed. The working approach is to poll the broker for what it actually stored, which measures one level deeper than the callback and is the only reason a consumer whose commits are silently failing does not look perfectly healthy.
The invariant metrics that come out of that are a small masterclass, for three reasons.
They are typed rather than boolean. A commit violation is one of gap, meaning a batch started past the committed offset so messages were skipped, out_of_order, meaning the partition moved backwards, or overlap, meaning a partial re-cover. Those want three different investigations, and a single counter merges them into one useless alert.
They ship with a denominator. Alongside the violation counter sits a plain count of commits checked, and the guarantee is stated as: the invariant holds while the denominator grows and the violation counter stays flat. Without it, a violation counter at zero is ambiguous between the invariant holding and the checker having stopped, and those look identical on a dashboard. Every must-stay-zero metric needs a must-keep-growing one beside it.
They are honest about their own noise. One order sentinel carries a note saying it is near-zero rather than hard-zero, because a rebalance racing an in-flight batch produces a rare false positive until a planned fix lands. Writing down which alarm is allowed to be slightly noisy, and why, is the difference between an alert people act on and one people mute.
A shorter example makes the same point about instruments. A queue-depth gauge overstated memory by exactly the number of partitions a pod was assigned, because the client forwards every partition queue into one shared queue and each partition then reports the whole thing. It was caught by an impossibility argument rather than a threshold: a pod reported more queued bytes than its container was allowed to use, which cannot be true. That same code refuses to label those gauges by partition or broker, because the metrics facade cannot unregister a series, so a partition that moves to another pod keeps reporting its last value indefinitely.
The last hop, and the four ways it swallows an event
The final stage, where the stream lands in the columnar store, is the one that gets the least attention and has the widest range of silent behaviours. A standard shape is a Kafka-engine table feeding materialized views into a ReplacingMergeTree. Feed it four kinds of bad input and you get four different outcomes, three of which are invisible.
A message that is not JSON is skipped and its offset committed. The data is gone, with no log line. A message that is valid JSON with one malformed field is also skipped silently. A message that is valid JSON but is not an event at all is stored, as a row of defaults dated 1970, so now there is garbage in the table and still nothing in the logs. And a valid event carrying a value that a view's cast rejects behaves differently again: the block fails, offsets never commit, and the table re-polls the same messages every few seconds indefinitely.
That fourth case is the one to design for, because materialized views are not atomic with each other. The view that succeeded keeps succeeding on every retry, so a single event accumulates duplicate rows for as long as the retry loop runs, and the ReplacingMergeTree collapses them later on merge. The concrete trigger is narrower than people expect: ClickHouse's JSON type rejects some payloads that are valid JSON, notably integers outside the range a 64-bit integer can hold, and a throwing cast inside a Kafka materialized view is a message the table cannot get past.
The numbers make the shape concrete. Feed a view with a plain JSON cast one event carrying the integer 99999999999999999999999, and the block fails, the offsets never commit, and the table re-polls the same message about every seven seconds: 254 attempts before the cast was fixed. Meanwhile the other view succeeds on each pass, so the events table holds 4 rows for that one event until a merge collapses them. With the non-throwing cast described next, the poison row lands with its payload preserved and the queue drains.
The mature handling is a cast that cannot throw, falling back to storing the original payload verbatim under a single reserved key such as $unparseable_properties. The bad value is neither dropped nor allowed to wedge the table, and it is still there to be repaired later. That is the pattern to copy.
Two scoping facts belong next to it. kafka_skip_broken_messages covers parsing a message into a row and nothing else, which is why it does not help with the valid-JSON non-event and does not help with a failure inside a view. Set it to match the consume block size rather than to an arbitrary number, so the skip budget covers a whole block instead of running out partway through one.
And the detection lesson, which is the one we would put on a wall. Checking for gaps with count() on a table that stores duplicates reports the expected number of rows and no missing offsets, because duplicates fill the hole. Counting distinct offsets instead reports the hole correctly. In a pipeline that manufactures duplicates by design, a gap check that is not duplicate-aware will tell you everything is fine.
What it adds up to
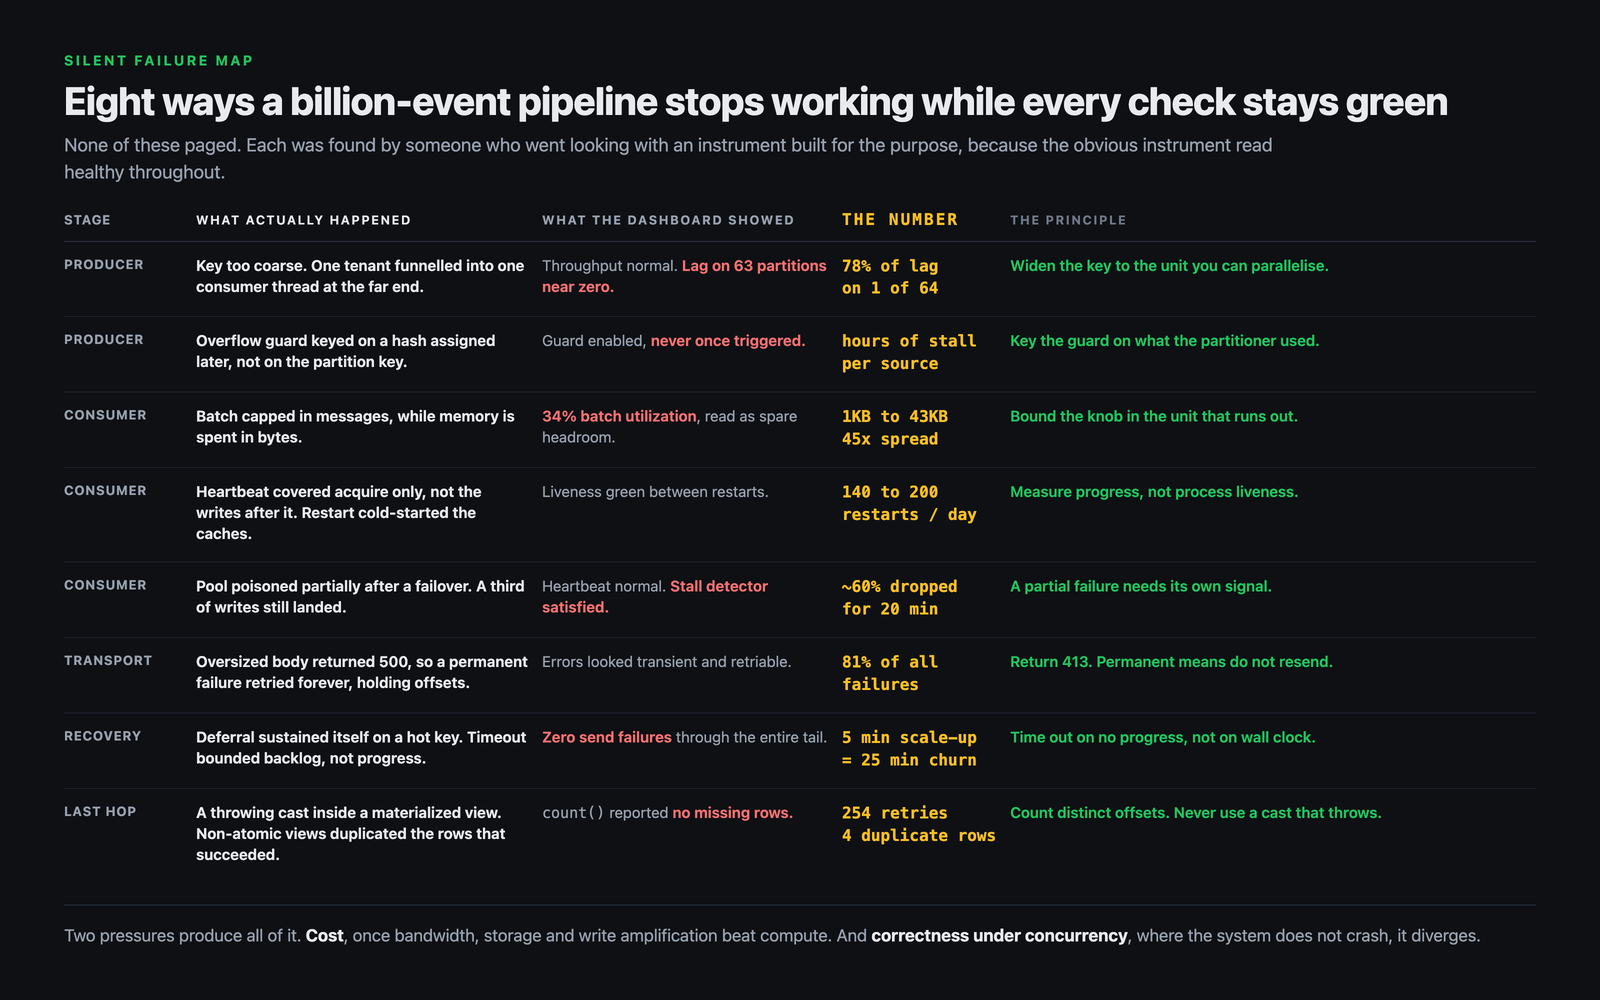
Scale does not change what a pipeline does. It changes what you are optimizing for, and it changes what failure looks like.
The clearest illustration is a set of settings that look wrong in isolation. A capture producer running acks=all with idempotence turned off and at most two retries is openly accepting duplicates. It is correct, because the store at the end is a ReplacingMergeTree keyed to collapse them on merge, and because producer-level exactly-once would cost in-flight concurrency on the hottest path in the system. The guarantee is chosen once across the whole path, and then each layer is configured to its part of it. Audit any one layer alone and you would file a bug against a working design.
Everything above is then one of two pressures. It is cost, because at a billion events bandwidth, storage and write amplification become the constraint rather than compute, which is why table definitions cap dynamic JSON paths so one customer's property names cannot explode the part count, why recent-events tables partition by day with a short TTL that drops whole parts instead of rewriting rows, and why those tables are keyed on ingestion time rather than event time so a late arrival cannot resurrect an expired partition. Or it is correctness under concurrency, where the system does not crash, it diverges: a partition that stopped moving, a guard that cannot fire, a knob counting the wrong unit, a health check passing at 60% loss, a metric reading 34% when it means 100%.
None of them announce themselves. Every one was found by someone who went looking with the right instrument, and in several cases the instrument had to be built first because the obvious one was a no-op. The architecture is the easy half, and it is the half that fits on a whiteboard. The hard half is knowing which of your green lights is lying, and building the thing that catches it before a customer does.
What it is not
This is not a benchmark, and it is not a ranking of one pipeline against another. It is a map of the failure modes that appear at this volume and the mechanisms behind them, which is a different thing from a recommendation about what to run.
Two things cut against the tidy version of the story. Several of the guards described here are correct designs that ship behind flags, so a given deployment may not be running them, which is why defaults matter as much as code. And at least one of the invariant alarms is documented by its own authors as near-zero rather than zero, because a rebalance race can produce a false positive. Neither makes the designs worse. Both are the difference between reading a codebase and understanding a system.
What to do with this on Monday
- List every green light in your pipeline and ask, for each one, what it would show if the process stayed up and the data stopped. In most stacks at least one would hold green straight through an outage.
- Point a stopwatch at your committed offsets and at the timestamp of your newest readable record. If neither is on a dashboard, liveness is standing in for both.
- Check that every hot-key or rate guard is keyed on the same value the partitioner used. A guard keyed on anything else cannot fire.
- Check the unit of every capacity knob against the resource that actually runs out. A utilization metric reading well under 100% at saturation is the tell.
- If your store dedupes, re-run your gap checks on distinct offsets rather than
count(). Duplicates fill holes and hide them.
Method: mechanisms traced to the code path and setting that produced them, defaults read at a fixed commit, and the last hop reproduced on a bench to observe the four failure behaviours directly. Related: freshness SLAs · fourteen ways agents fail with every check green · the Snowflake meter.